Institutional Research - Full & Part-Time Enrollment
Trends in Full & Part-Time Enrollment of Degree-Seeking Students
Summary of Trends
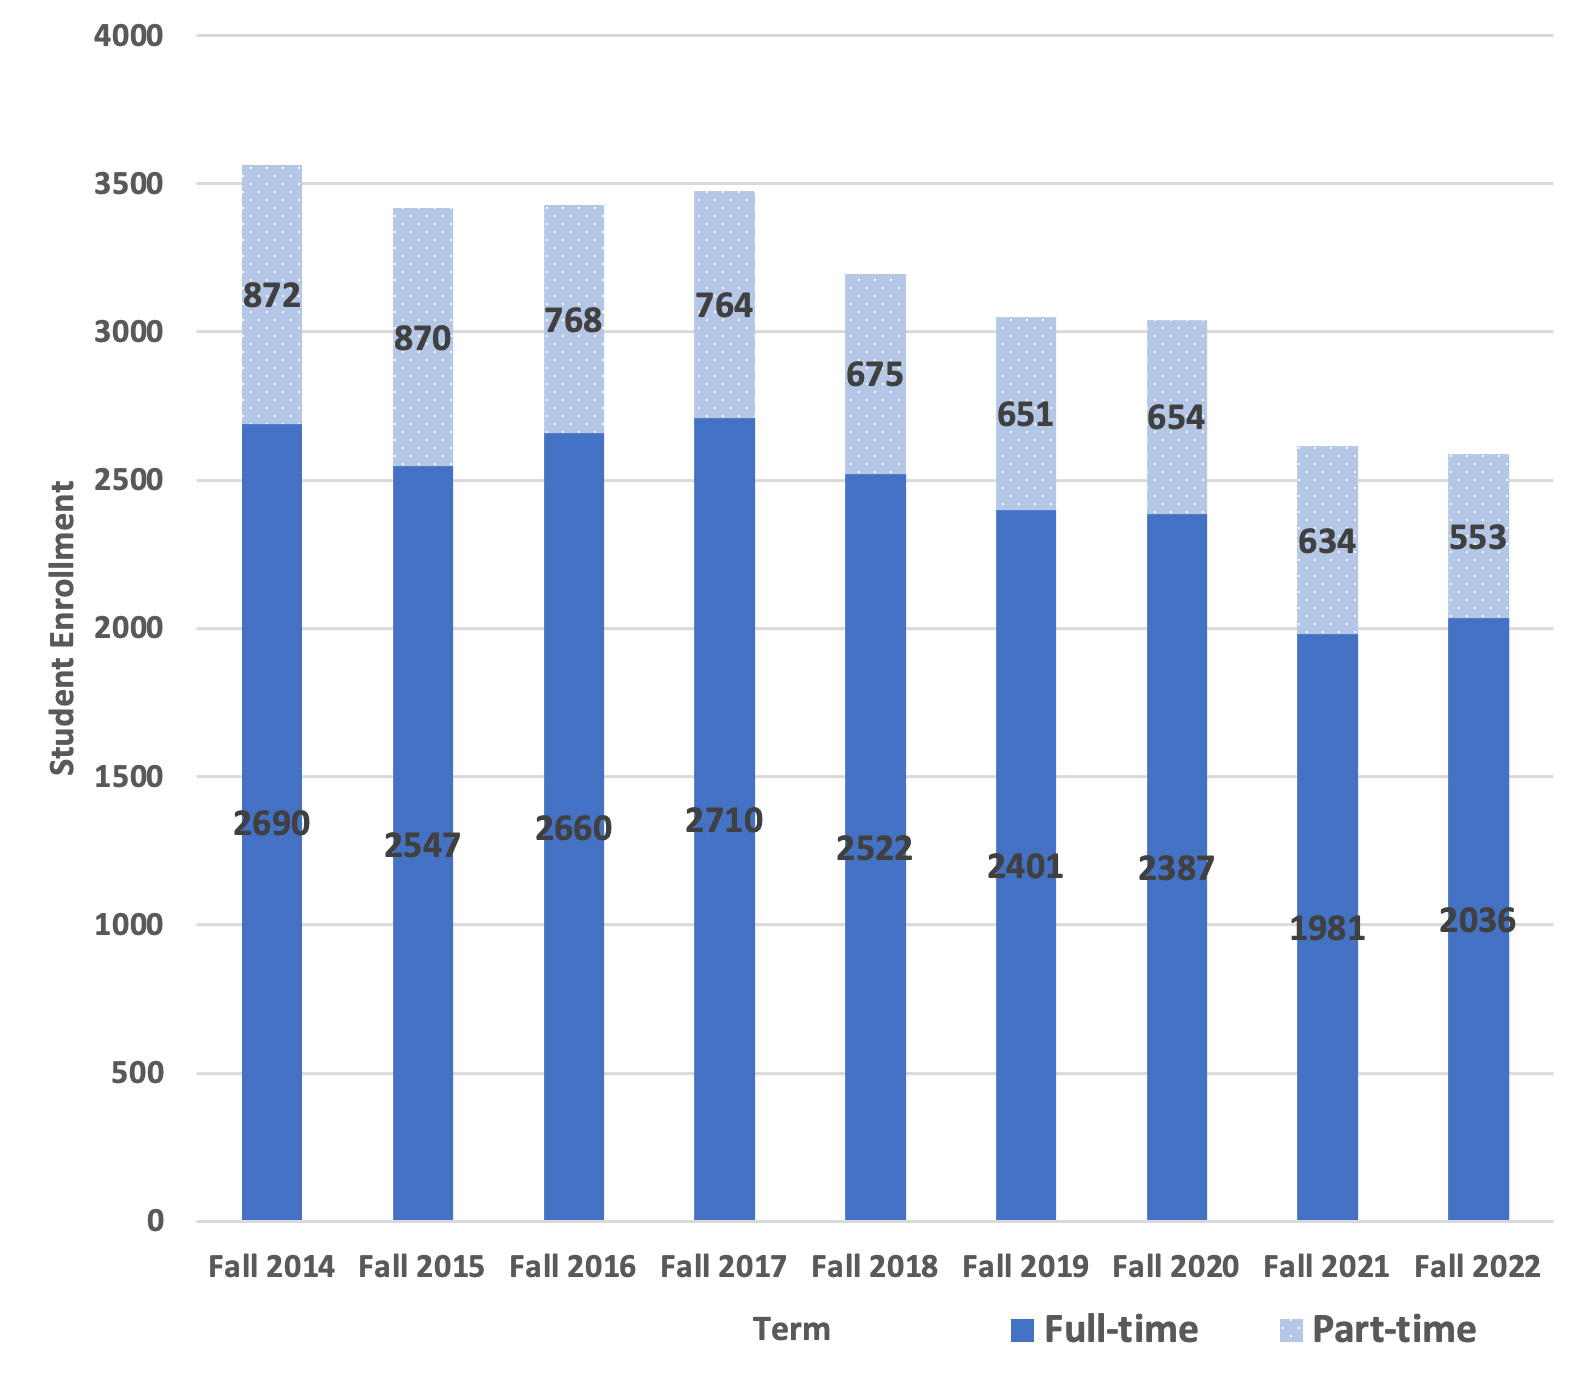
Summary of trends = These data track degree seeking student enrollment for Fall semesters, and ranges an nine-year span between Fall 2014 and Fall 2022; both undergraduate and graduate students are included, excluding non-matriculated students. The data table also includes the FTE figures, which stands for “Full-Time Equivalent” and is calculated based on both full-time and part-time enrollment. Overall enrollment peaked in the Fall 2014 term at 3,562 students, and while decreasing slightly over the next three years, remained fairly constant until the Fall 2017 term in which 3,474 students were enrolled overall. While remaining steady, there have been declining figures since the Fall 2017 term which mirrors enrollment nationally.
| Fall 2014 | Fall 2015 | Fall 2016 | Fall 2017 | Fall 2018 | Fall 2019 | Fall 2020 | Fall 2021 | Fall 2022 | |
|---|---|---|---|---|---|---|---|---|---|
| Full-time | 2690 | 2547 | 2660 | 2710 | 2522 | 2401 | 2387 | 1981 | 2036 |
| Part-time | 872 | 870 | 768 | 764 | 675 | 651 | 654 | 634 | 553 |
| Total | 3562 | 3417 | 3428 | 3474 | 3197 | 3052 | 3041 | 2615 | 2589 |
| FTE* | 2981 | 2837 | 2916 | 2965 | 2747 | 2618 | 2605 | 2192 | 2220 |
*FTE stands for Full-Time Equivalent, and is calculated based on both full-time and part-time enrollment. These figures include both undergraduate and graduate students, and excluded non-matriculated students.