Institutional Research - Graduation Rates

Graduation Rates

The graphs below represent both 100% and 150% graduation rates for the Associate and Baccalaureate cohorts, respectively.  A cohort is defined as incoming first-time, full-time students for the indicated fall term. The 150% rates include those who graduated within the 100% timeframe.  It is important to note that students are counted as a graduate regardless of what level they achieved a degree; for example, if a baccalaureate student earned an associate degree but did not earn a baccalaureate degree, they are still included below.  For both associate and baccalaureate graduates, the 150% rates are much higher than 100% rates, and have remained fairly consistent over a six-year period; associate cohorts in the graph range from those entering in the Fall 2011 term through Fall 2017, whereas baccalaureate cohorts range from Fall 2008 – Fall 2014.

Trends in Associate Graduation Rates
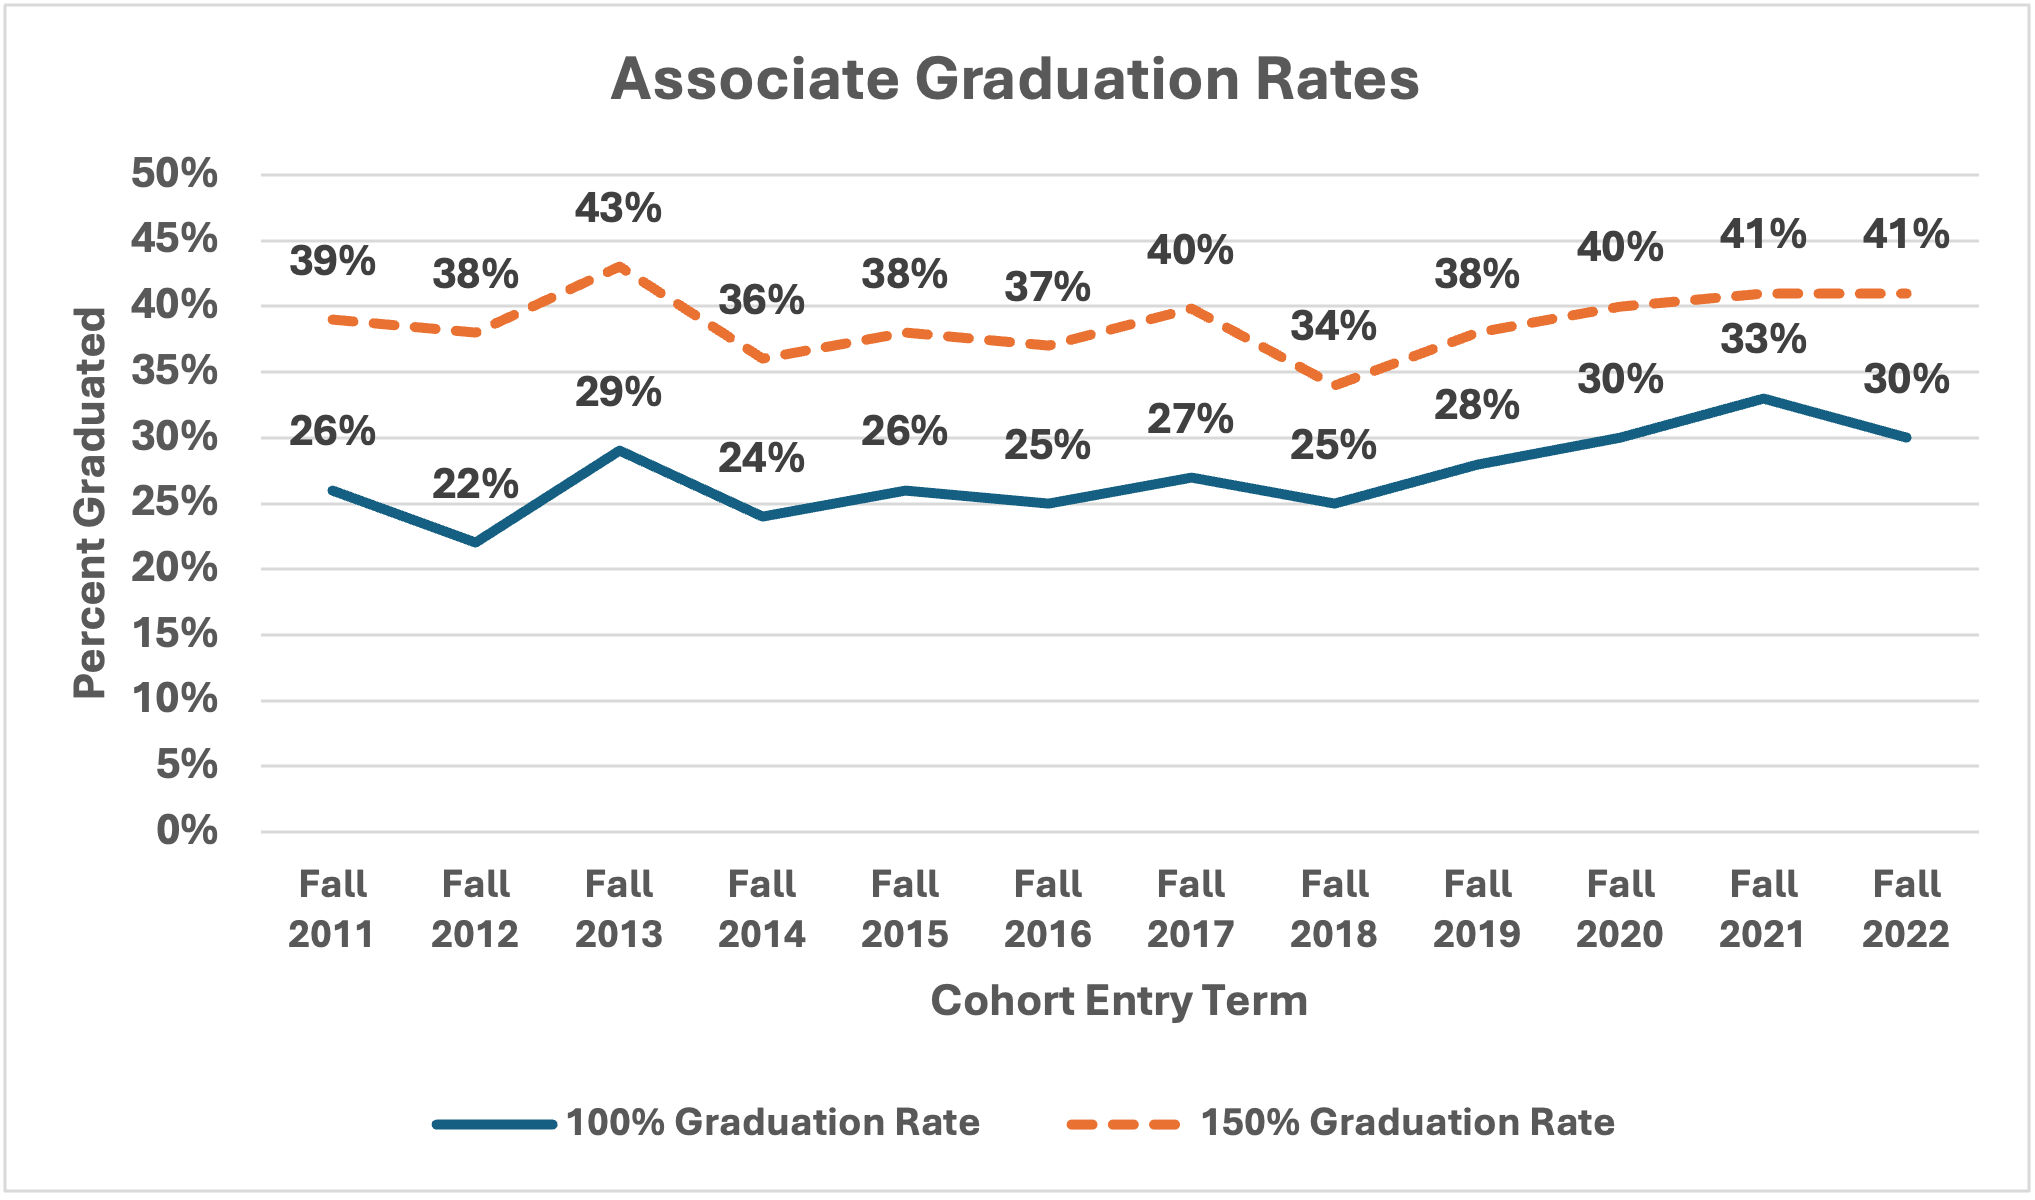
Alt text - Line graphs showing the 100% and 150% graduation rates for first-time, full-time associate and baccalaureate students. Please refer to the summary below.

Summary of Trends

  • 100% graduation rates for associate students in Fall 2011 were 26%, and while there were small increases and decreases, the rate remains stable at 27% for the Fall 2017 cohort.
  • 150% associate graduation rates are also stable, at 39% in the Fall 2011 cohort, to 40% in Fall 2017.

Data Table for Associate Graduation Rates

  Fall 2011 Fall 2012 Fall 2013 Fall 2014 Fall 2015 Fall 2016 Fall 2017 Fall 2018
N 798 819 825 877 743 792 834 693
100% Graduation Rate 26% 22% 29% 24% 26% 25% 27% 25%
150% Graduation Rate 39% 38% 43% 36% 38% 37% 40% 34%

Trends in Baccalaureate Graduation Rates
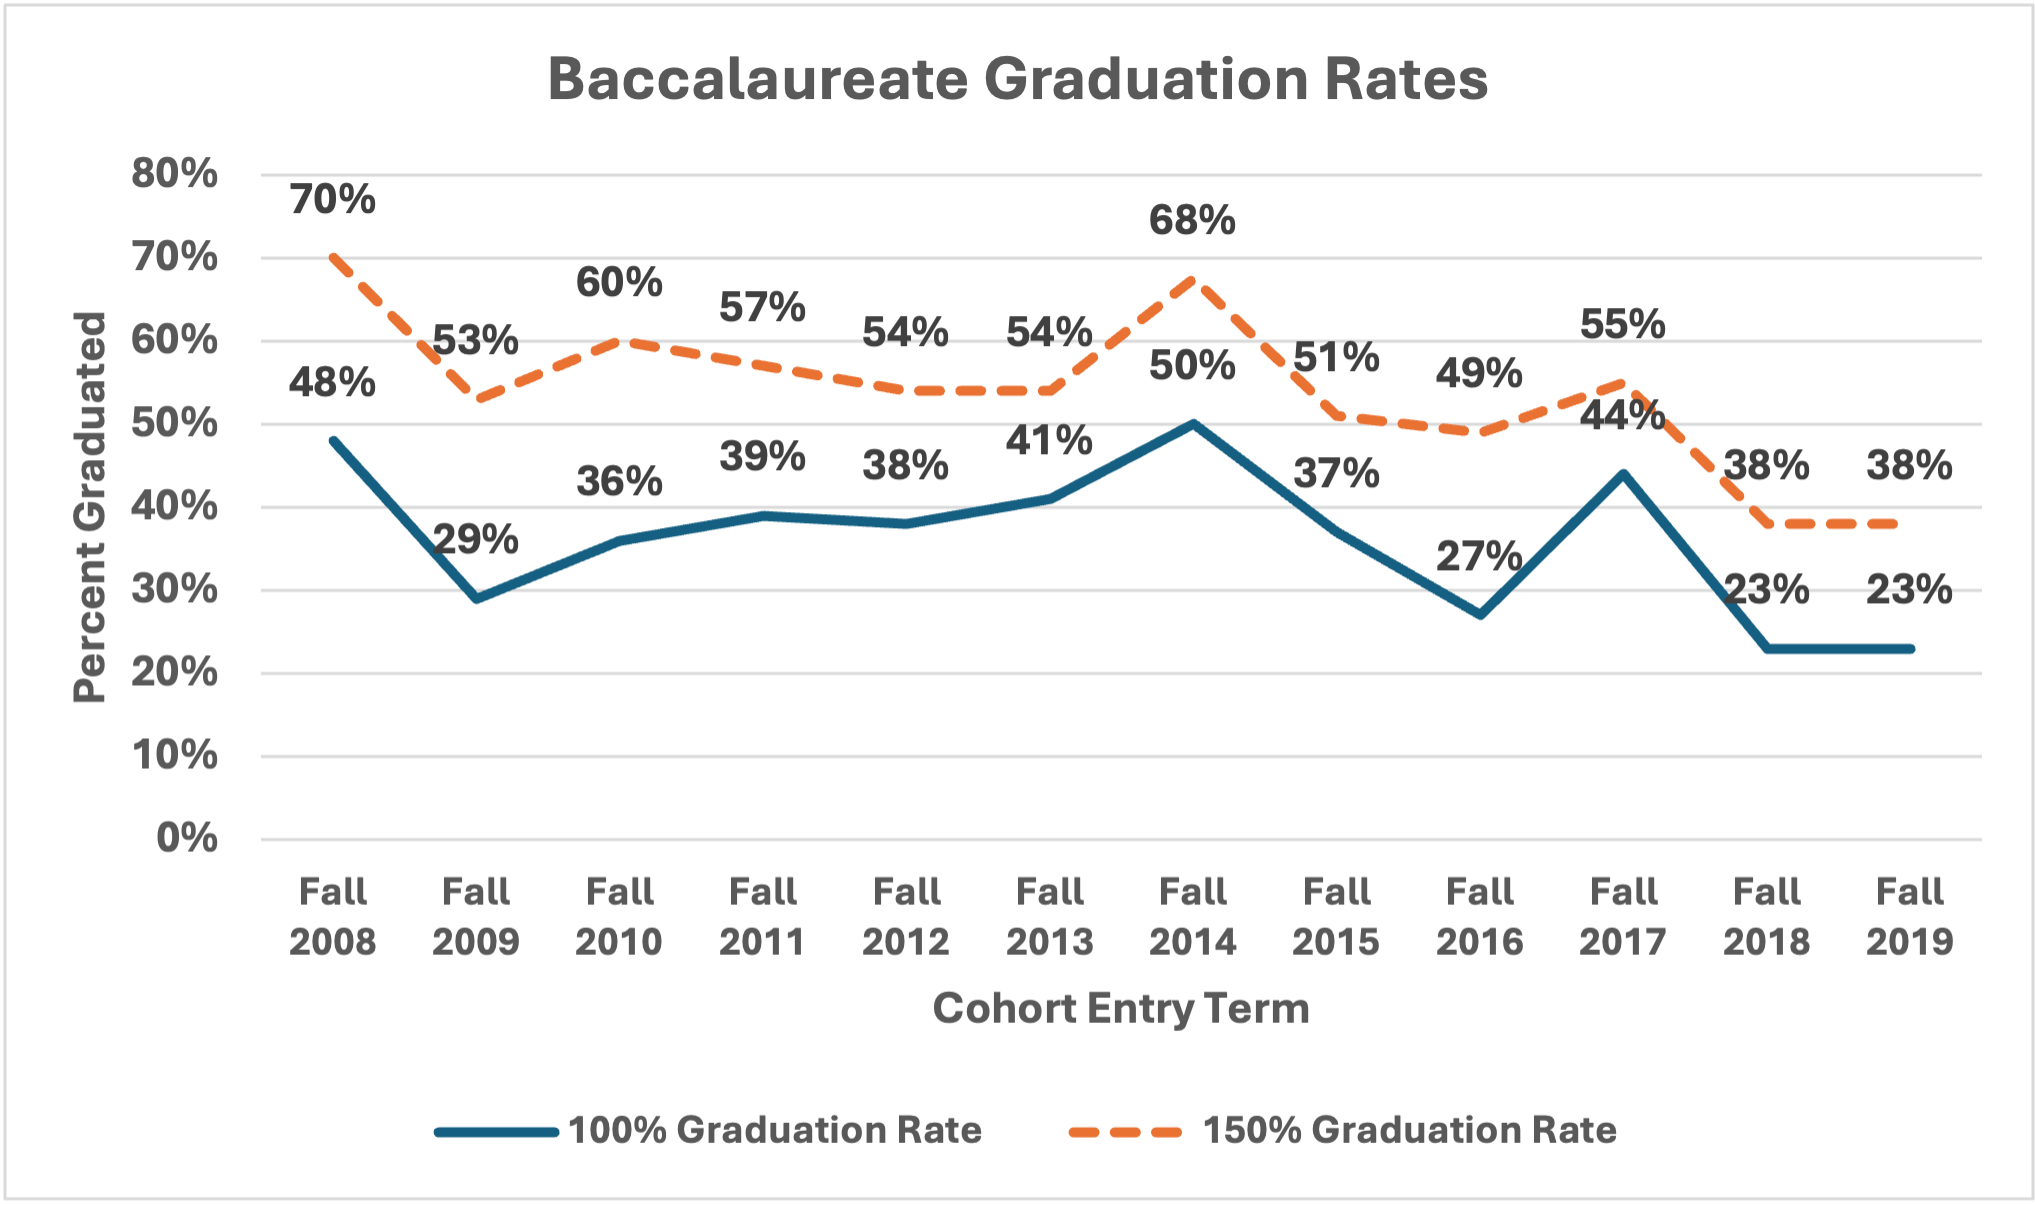
Line graphs showing the 100% and 150% graduation rates for first-time, full-time associate and baccalaureate students.  Please refer to the summary below.

Summary of Trends

The above graphs represent both 100% and 150% graduation rates for the Associate and Baccalaureate cohorts, respectively (150% = 3 years for associate, 6 years for baccalaureate students).  

A cohort is defined as incoming first-time, full-time students for the indicated fall term.  The 150% rates include those who graduated within the 100% timeframe.  For both associate and baccalaureate graduates, the 150% rates are much higher than 100% rates, and have remained fairly consistent over a six year period; associate cohorts in the graph range from those entering in the Fall 2011 term through Fall 2017, whereas baccalaureate cohorts range from Fall 2008 – Fall 2014.  

100% graduation rates for associate students in Fall 2011 were 26%, and while there was small increases and decreases, the rate remains stable at 27% for the Fall 2017 cohort.  150% associate graduation rates are also stable, at 39% in the Fall 2011 cohort, to 40% in Fall 2017.   Baccalaureate 100% rates are fairly stable as well, ranging from 48% in Fall 2008 to 50% in Fall 2014.  

The 150% baccalaureate rates has the highest gap in rates over the six year span, ranging from 70% in Fall 2008 to 54% in Fall 2012 and 2013; however, as shown in the data table, the “n” for this population is so small that even one or two graduates can have a strong impact on the percentage rates for graduates.  The figure jumped from 54% to 68% in Fall 2014, further speaking to the impact of the small n, and that over a 7 year span, rates are holding steady.

Data Table for Baccalaureate Graduation Rates

  Fall 2008 Fall 2009 Fall 2010 Fall 2011 Fall 2012 Fall 2013 Fall 2014 Fall 2015
N 60 62 45 82 100 105 80 79
100% Graduation Rate 48% 29% 36% 39% 38% 41% 50% 37%
150% Graduation Rate 70% 53% 60% 57% 54% 54% 68% 51%


Questions?
Office of Admissions

118 Bush Hall