Institutional Research - Retention Rates
One-Year Retention Rates
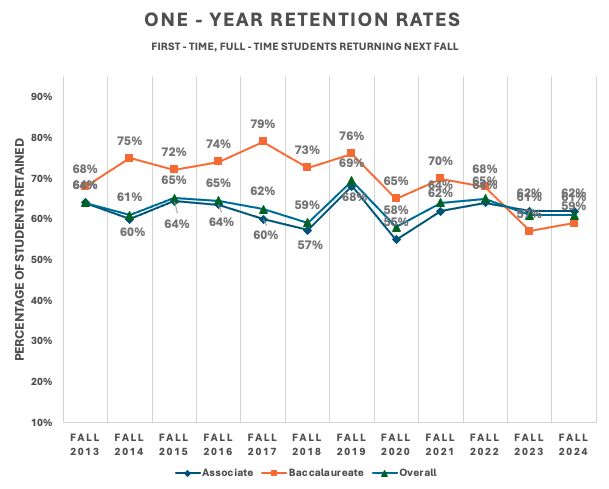
The below data table and graph tracks Retention Rates for first-time, full-time undergraduate students entering during the indicated term who returned the subsequent fall semester.
Example: 61% of first-time, full-time freshmen who started in the Fall of 2023 returned in the Fall 2024 term.
| Fall 2013 | Fall 2014 | Fall 2015 | Fall 2016 | Fall 2017 | Fall 2018 | Fall 2019 | Fall 2020 | Fall 2021 | Fall 2022 | Fall 2023 | Fall 2024 | |
|---|---|---|---|---|---|---|---|---|---|---|---|---|
| Associate | 64% | 60% | 64% | 64% | 60% | 57% | 68% | 55% | 62% | 64% | 62% | 62% |
| Baccalaureate | 68% | 75% | 72% | 74% | 79% | 73% | 76% | 65% | 70% | 68% | 57% | 59% |
| Overall | 64% | 61% | 65% | 65% | 62% | 59% | 69% | 58% | 64% | 65% | 61% | 61% |
Summary of Trends
- These data track fall-to-fall retention rates of first-time, full-time undergraduate students over an eleven-year span, ranging from Fall 2013 to Fall 2023.
- Of the three categories (Associate, Baccalaureate, and Overall), the Associate and Overall are the most similar.
- Overall rates remain similar to ten years ago. In 2023, rates were 61%, the same as in 2014.
- The Baccalaureate rates peaked in the fall 2017 term at 79%, which was the third year of increases, and has decreased by 11% since that time. There is a large decrease between Fall 2022 and Fall 2023 in terms of percentage. However, the cohort of students increased dramatically between the two years, and while the percentage of students declined, the actual number of students retained remained steady.